
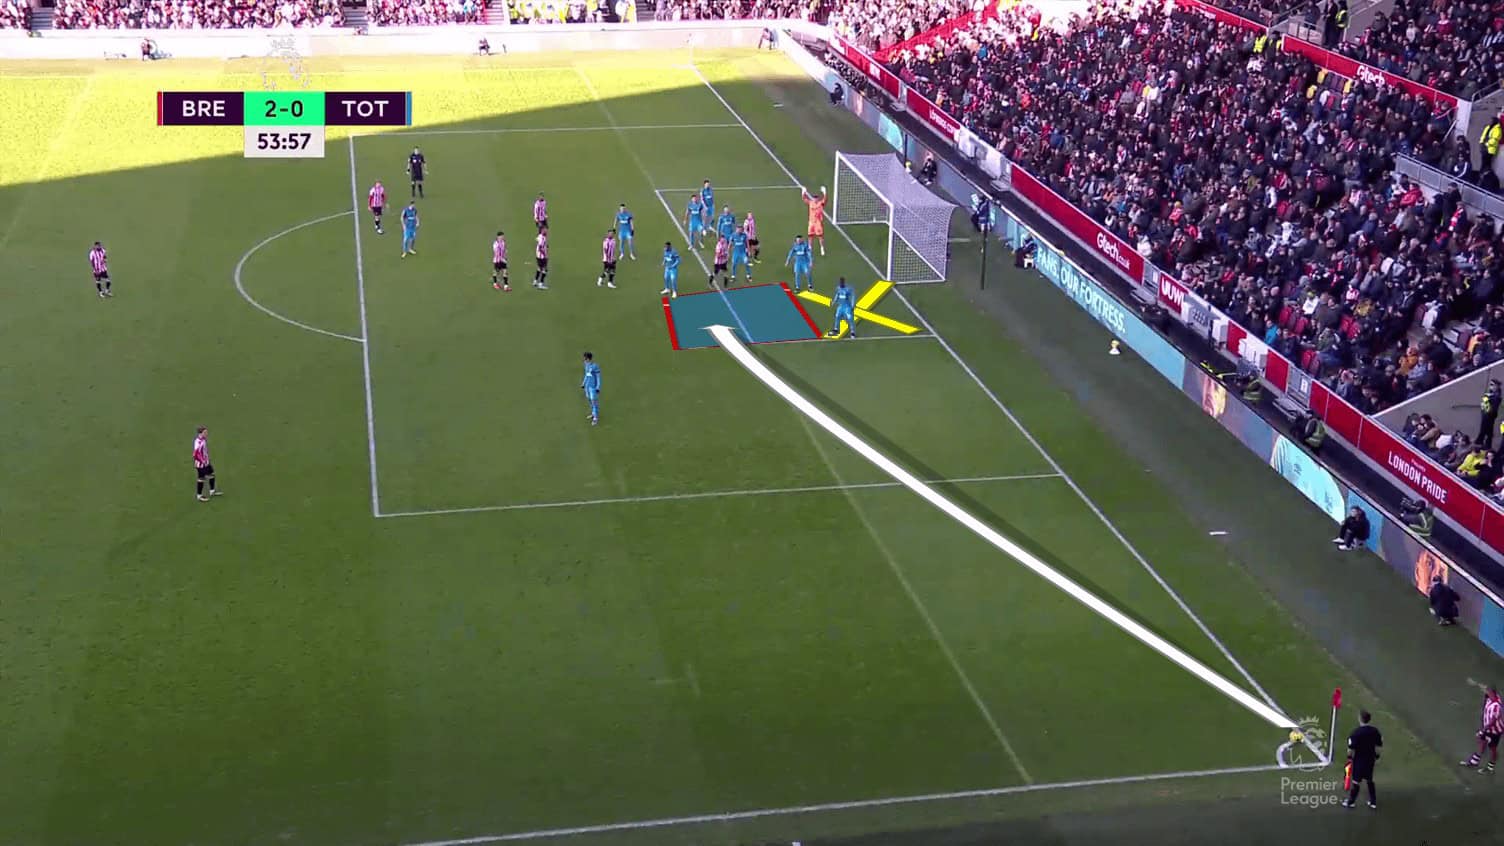
For years, corner analysis in football has largely revolved around one question: How many corners does a team usually win?
But a new analysis of the 2025/26 Premier League season suggests that the answer may be hiding several layers deeper.
Two teams can average almost the same number of corners while creating them through completely different attacking structures.
One may repeatedly push opponents towards their own byline through aggressive flank combinations, while another may arrive at a similar total through isolated attacks, deflections or late pressure.
That distinction matters because the average does not explain how the corners are being created — or whether that mechanism is likely to repeat.
A study by football analytics platform Tips.GG examined the player-level mechanics behind Premier League corners, focusing on winger-full-back relationships, attacking width, player height, support runs, defensive pressure and the routes through which attacks reach the byline.
The findings point to an important conclusion: the geometry of a team’s attacking flank can be as revealing as its historical corner average.
The corner often starts long before the corner flag
A corner kick may appear in the statistics as a single event, but the attacking sequence that produces it can begin several actions earlier.
A winger beats a defender. A full-back overlaps. A low cross is blocked. A delivery is deflected. A defender clears the ball over the goal line.
Those individual actions are more common in wide areas, which makes the structure of the flank particularly important when trying to understand where corners come from.
The study describes a flank pairing as two players operating at different levels on the same side of the pitch. Most commonly, that means a winger and full-back, although the relationship can also involve a wing-back and interior midfielder or a wide centre-back and a more advanced teammate.
The critical issue is not simply having two players out wide, it is where they are positioned relative to each other.
When the two players occupy roughly the same height, the attack can become more linear. But when one player is deeper and the other higher, a diagonal relationship develops.
That creates additional attacking possibilities. According to the study, the deeper player may have space to overlap, while the ball can also be played into the higher player before the first player continues forward for a return pass.
That structure does not automatically produce a corner. But it can make it easier for a team to progress towards the byline- the area where crosses, take-ons, blocks and defensive clearances are more likely to produce corners.
Enter OverlapAngle
To measure that relationship, Tips.GG introduced a metric called OverlapAngle.
Rather than using a player’s single position at a particular moment, the metric looks at the average zones in which the two players in a flank pairing performed their on-ball actions.
A value close to zero indicates that the two players operated at roughly the same height. A larger angle indicates a stronger diagonal, with one player operating deeper and the other higher.
Importantly, this is not a tracking-based measurement of where players physically spent most of the match. It is calculated from the average coordinates of their on-ball actions using Wyscout data.
That distinction matters because the metric is intended to describe the attacking structure rather than provide a literal heat map of every movement.
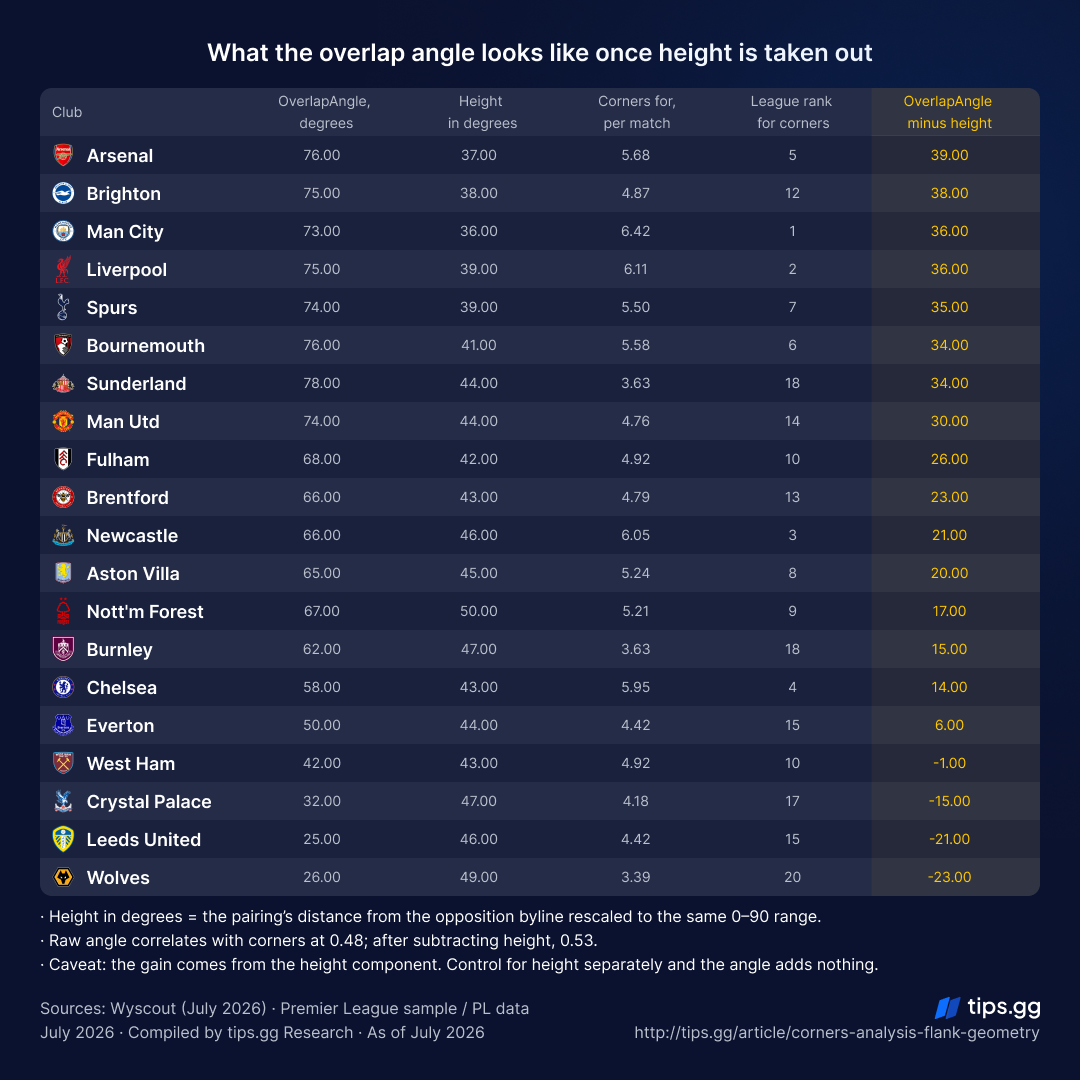
During the closing stretch of the 2025/26 Premier League season, OverlapAngle recorded a 0.48 correlation with corners won according to the study.
That does not mean a particular angle guarantees a certain number of corners. It indicates that the geometry of the flank was meaningfully associated with corner production.
But there was a problem. The angle alone was not enough. A team could have two players positioned diagonally while still being a long way from the opposition’s goal.
That led to another important variable: height.
The closer the flank is to the byline, the bigger the potential
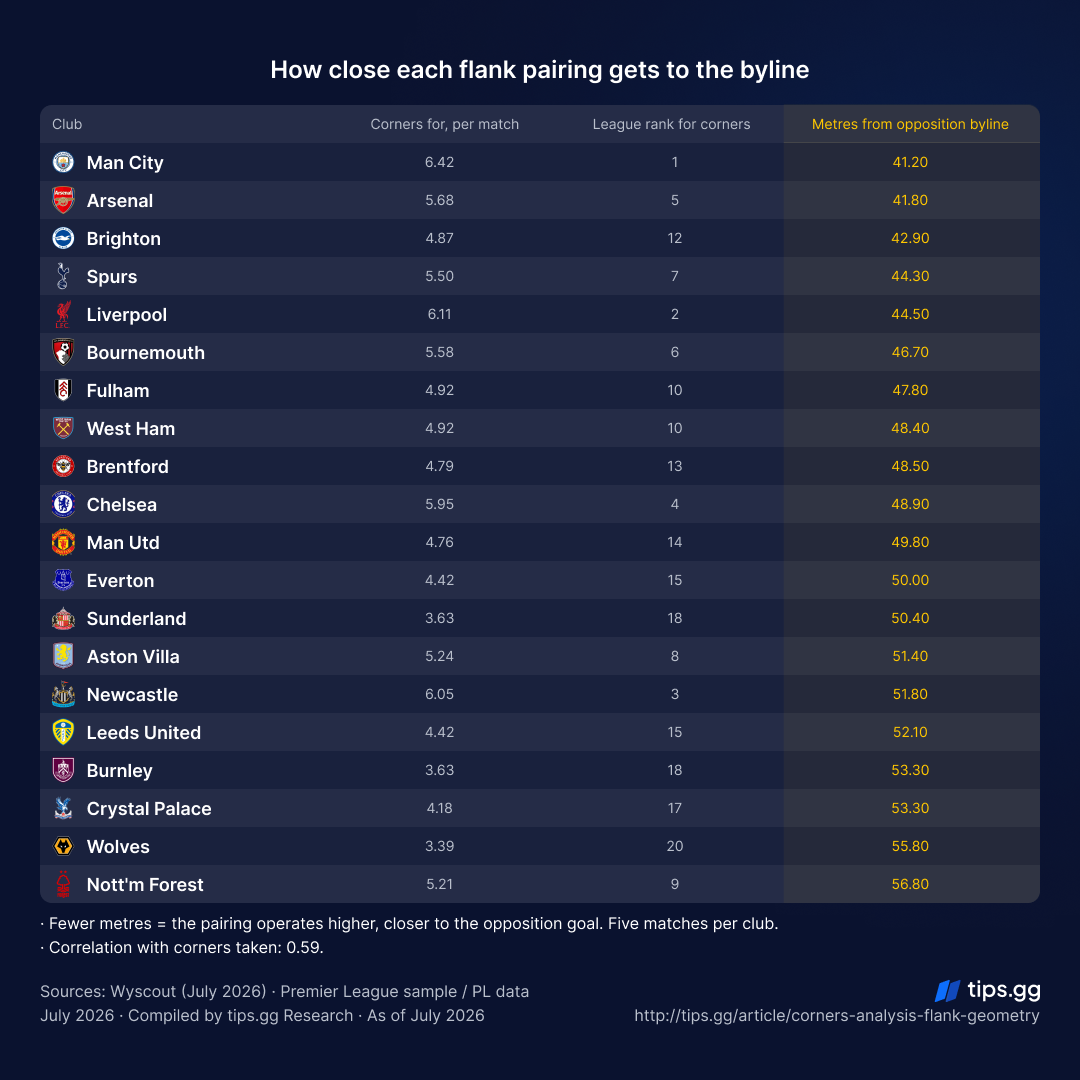
The study measured the average distance between a flank pairing and the opposition byline.
This matters because an attacking structure positioned 42 metres from the byline is not in the same situation as one positioned 56 metres away, even if the two have an identical OverlapAngle.
The higher pairing needs fewer actions and less time to reach the danger area.
And time gives defenders an opportunity to reorganise.
The study also measured the lateral gap between the two players’ average action zones.
Across the sample, the median distance from the opposition byline was 49.3 metres, while the median lateral gap between players was six metres.
Those figures were then used to divide flank structures into four categories:
- High compact
- High stretched
- Low compact
- Low stretched
The results produced one of the study’s clearest findings.
High pairings produced more corners
Teams with high compact flank pairings averaged 5.58 corners per match.
High stretched pairings followed with 5.22, while low compact pairings averaged 4.81.
At the bottom were low stretched pairings, averaging 4.36 corners per match.
The gap between high compact and low stretched structures was therefore 1.23 corners per match.
At first glance, however, there was an obvious problem: some of the Premier League’s strongest teams – including Manchester City, Liverpool and Arsenal were in the high-compact group.
Perhaps the difference simply reflected team quality. So the analysis controlled for points won.
The difference between the extreme groups dropped from 1.23 to 0.58 corners, but remained statistically significant.
That strengthened the case that flank height itself was contributing something beyond overall team quality.
Height mattered more than simply being close together
One of the more interesting findings was that the two axes did not carry equal weight.
After adjusting for team quality, height remained associated with increased corner production, while a small lateral gap did not show the same independent advantage. High-stretched pairings slightly outperformed high-compact ones relative to expectations.
That suggests the most reliable signal was not necessarily how close the two players were to one another.
It was how high up the pitch they operated. The closer the attacking pairing was to the opposition byline, the fewer actions and less time were required before an attack could end in a cross, block, deflection or clearance.
That does not mean a team should automatically be expected to win more corners simply because its wide players are advanced.
Team quality, style and match context still mattered.
Even within the high-compact group, average corner production ranged from 4.87 to 6.42 corners per match.
The geometry helps explain the mechanism. It does not eliminate the other variables.
The opponent’s flank structure matters too
Perhaps the most interesting step in the research was examining what happens when different flank profiles meet.
A team’s attacking structure does not operate in a vacuum. It interacts with the structure of the opponent.
The study found a particularly striking combination when high-compact pairings faced low-compact pairings.
In those matches, the high-compact team averaged 8.0 corners, while the combined match average reached 12.71 corners.
That was considerably different from the same type of team facing a low-stretched pairing, against which it averaged 6.38 corners.
The explanation lies in the space and pressure created along the flank.
When one side consistently positions its attacking pairing high while the opposing structure remains deeper in the same corridor, the attacking team can repeatedly bring the ball into areas where crosses, blocks and defensive clearances become more likely.
It is not simply about “attacking more.”
It is about where the attack ends up and what defensive structure it encounters there.
Formation can completely change the equation
This is where the research becomes particularly relevant to match previews.
A team’s season-long corner average may tell only part of the story because the structure behind that number can change dramatically when the formation changes.
In a traditional back four, the flank is usually shared by a winger and full-back.
The study found that the full-back was the wider player in 64% of observations, while the winger occupied the wider position in roughly one-third of cases.
That creates a natural two-player relationship on the flank.
The winger can move inside and allow the full-back to overlap, or remain wide while receiving support from deeper.
The situation changes with a back three.
In 88% of observations, the wing-back was the widest player and generally the only permanent player occupying the outside channel.
A second player therefore has to move out from a more central position.
That player is often an interior midfielder.
And that matters because the study found that wingers operated an average of 40.4 metres from the opposition byline, compared with 50.6 metres for interior midfielders.
The interior midfielder therefore has more ground to cover before becoming part of the wide attacking combination.
That extra movement can give the opposition time to shift across, potentially slowing the attack before it reaches the byline.
Chelsea and West Ham show why formation matters
The effect becomes even clearer when looking at teams that used different defensive structures.
Chelsea’s average OverlapAngle was approximately 70 degrees with a back four, but fell to around 24 degrees with a back three.
West Ham showed an even larger change, moving from approximately 64 degrees to just 7 degrees.
That means the diagonal relationship between the two players in the flank pairing almost disappeared when the formation changed.
That is why the study argues that a team’s flank profile should be treated as a product of its formation, line-up and player roles, rather than as a permanent characteristic of the club.
The player matters as much as the formation
This is another reason historical averages can become misleading.
A team may have spent months producing corners through a winger-full-back partnership.
Then a winger is replaced by an interior midfielder.
Or a full-back becomes a wing-back.
Or a regular overlapping full-back is absent.
Suddenly the same team is operating through a different geometry.
The historical corner average remains in the database.
But the team taking the pitch is no longer creating its attacks through precisely the same mechanism.
That makes player availability and tactical roles crucial variables when analysing corner potential.
Being behind does not automatically mean more corners
There is another common assumption in football betting and analysis: if a team falls behind, it will attack more, therefore it will win more corners.
The study challenges that shortcut.
It argues that a team can concede and increase its attacking intensity without necessarily changing its flank structure.
It might dominate possession, spend more time in the final third and deliver more crosses – but still fail to consistently reach the byline.
Conversely, a team may respond to going behind by pushing its wide players higher, creating additional overlaps and reaching the byline more frequently.
That is a much stronger indication of increased corner potential.
The key question is therefore not simply:
“Who is losing?”
It is:
“Has the losing team changed the mechanism through which it attacks?”
If the answer is yes, the corner threat may genuinely have changed.
If the answer is no, rising possession and attacking pressure may not tell the whole story.
What this means for analysing Premier League corners
The study does not claim to have discovered a formula capable of predicting the exact number of corners in a match.
Instead, it offers a different way of looking at the market.
Corner averages tell us what has happened.
Flank geometry attempts to explain why it happened.
That distinction is important.
A team averaging five corners per game does not automatically make an over-4.5 corner line attractive.
The price matters, while the tactical conditions that produced those five corners need to be examined to determine whether they are likely to be repeated.
That means a serious pre-match analysis should look beyond the headline corner statistics.
It should ask:
Who is playing on the flanks?
How high are they operating?
Who provides the overlap or supporting run?
What formation is the team using?
How does the opponent defend the same flank?
Is the team consistently reaching the byline?
And, particularly during live matches:
Has the scoreline actually changed the attacking structure?
Those questions can reveal changes that a season average cannot.
The bigger lesson: corners are a tactical outcome
The most important takeaway from the research is perhaps the simplest.
A corner is not just a number.
It is the final product of a sequence of tactical decisions.
Where a winger stands affects where a full-back can run.
Where the full-back stands affects the defender’s decision.
The opponent’s positioning affects the available space.
The formation determines who can provide width and support.
The scoreline can force a team to change its structure.
And all of those decisions can eventually determine whether an attack ends with a shot, cross, block, deflection – or a ball over the goal line for a corner.
That is why two teams with almost identical corner averages can have very different corner potential on a particular day.
The numbers remain useful. But the geometry behind the numbers may tell the more interesting story.
Source: Tips.GG’s analysis of Premier League corner mechanics, based on 2025/26 season data. The original research examines flank geometry, player positioning, formation and corner production.